
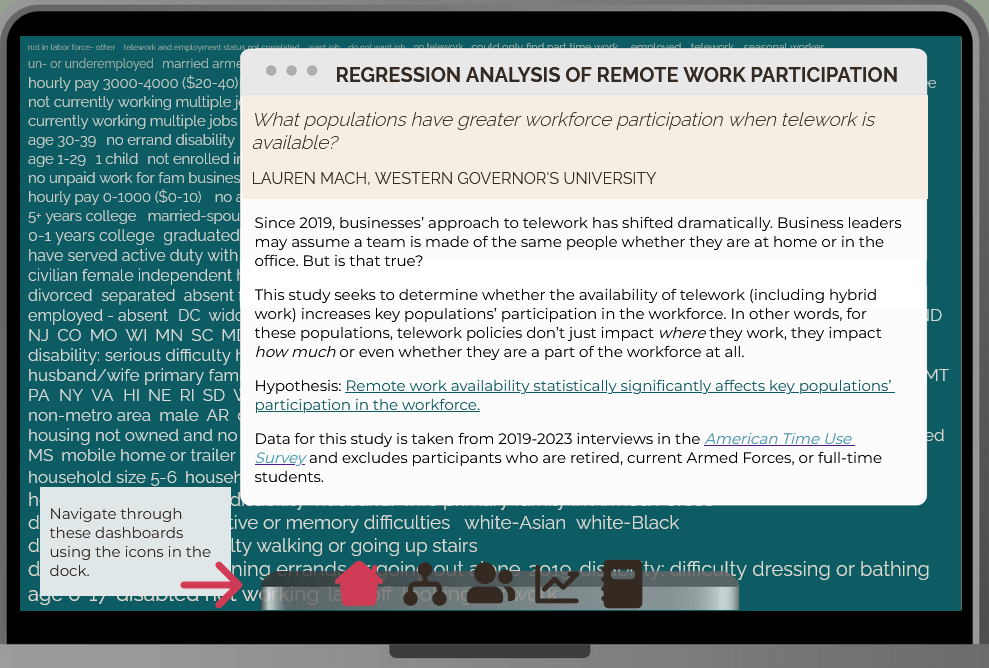
This Tableau Public presentation visually communicates the results of my 2025 Masters in Data Science thesis, Regression Analysis of Remote Work Participation. The presentation is designed for a non-technical audience and goes through the research process, including:
- Background and problem
- Research question and hypothesis
- Data source
- Population selection process
- Comparison of target population to full dataset
- Linear regression results and findings
- Limitations
- Suggestions for further research
- Implications for business
Executive Summary
Since 2019, businesses’ approach to telework has shifted dramatically. Conversations about whether to allow telework (either in a fully remote or hybrid posture) often center on team dynamics, job requirements, competitor policy, or company culture. Less considered is how telework options change the makeup of the labor pool itself. When deciding to allow telework, business leaders may assume a team is made of the same people whether they are at home or in the office. But is that true? The hypothesis of this study is that the availability of telework (including hybrid work) increases key populations’ participation in the workforce. In other words, for these populations, telework policies don’t just impact where they work, they impact how much or even whether they are participating in the workforce at all.
The American Time Use Survey (ATUS) dataset is collected and maintained by the US Bureau of Labor Statistics (BLS) as part of the US Census (2024). Data from the 2003-2023 atuscps file is used comprising 298,841 observations and 92 variables. Observations are from 2019-2023 surveys. The variables include participant identifiers, demographics, work data, and personal information (Appendix A). Data preparation included the following steps:
- Importing desired columns from atuscps file and dropping pre-2019 rows
- Converting continuous variables for use in population selection (such as household size and age) into continuous variables based on distribution visualization
- Maintaining a ‘people’ dataset with identifier columns that can be used to subset participants (e.g. all 2019 participants or all identified population participants) without having to load the full dataset
- Renaming telework columns for clarity and creating combined “TELEALL” column
- Creating calculated employment status field for population selection based on both current employment (full/part-time/unemployed) and desired employment to identify underemployed individuals
- Creating calculated CORR field showing whether a participant’s employment and telework statuses are the same (counting underemployment with unemployment)
- One hot encoding and sorting variable dimensions based on CORR using both MCA and groupby to select target populations (Appendix B)
- Identifying variable dimensions that are >1 standard deviation above the mean (top16) or in the top quartile (top25) based on CORR value counts
- Creating calculated field RANK to quickly separate top16 and top25 populations
The research question is answered using an Ordinary Least Squares multilinear regression model (Appendix C). Using a 30/70 train/test split on the full dataset, PEHRUSLT (usual hours worked per week at all jobs; 0-150 continuous) is analyzed against rank, year, and telework variables. The model’s RMSE is 10.4 hours and the mean error of the training model’s predictions against the test set is 5.5 hours. According to this model, RANK is statistically significant in predicting hours worked across the dataset, meaning that the target populations do participate in the workforce at different rates than the whole population.
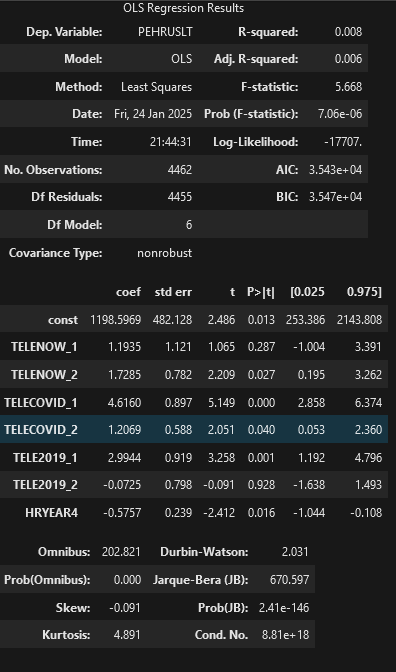
Duplicate models run on the top16 and top25 (inclusive) subsets reveal that for the targeted populations, telework is a statistically significant predictor of hours worked, with TELECOVID (Apr 2020-Oct 2022) telework rates the strongest positive indicator. The R squared of the models varied from 0.002-0.008, meaning telework access is not the primary reason workforce participation varies across the dataset or subsets, but it has a larger effect on the target populations (TELECOVID_1 +4.6 hours for top16 populations vs. +1.6 for full dataset).
A limitation of this study is the type of telework data available. ATUS is representative of the entire United States population, but telework data as a standalone question has only been included since late 2022. Additional data from questions asked about teleworking during and before the COVID-19 pandemic are used in this study, but do not have as many valid responses. More detailed information about telework arrangements (hybrid vs. fully remote, temporary vs. long-term) would provide a more nuanced understanding of how telework impacts workforce participation.
Suggestions for further study include:
- The impact of telework on workforce participation by industry or job type
- Projected candidate pool for a position if posted as telework vs. in-person
- Projected team makeup if telework is allowed vs. in-person only
Across the board, positive telework status is associated with increased workforce participation at a statistically significant level. This effect is stronger in the key populations, with the largest effect among those who are disabled, White-Black or White-Asian, have a household >7 people, and married couples where at least one person is currently in the Armed Forces.
These findings have several key implications for businesses. Expanding telework opportunities allows businesses to tap into a labor market that is otherwise limited or unable to access those positions. Fully remote positions allow companies to hire people who don’t live near their physical work location. Telework is more inclusive of disabled populations, which can increase retention, since anyone can become disabled at any time. A company that is prepared and open to flexible working arrangements is much better positioned to retain talent than one with limitations on how and where people work. Finally, many identified populations are underrepresented in corporations. Companies that are trying to be more representative of the populations they serve or incorporate perspectives that are different from the industry mainstream can find a different, more robust candidate pool with a telework position than they would with an in-person one.
Appendix A: Variables
| variable | type | used for data cleaning/formatting | used for population selection | used for regression | included for supplemental illustration only |
| TUCASEID | id | y | |||
| TULINENO | id | y | |||
| HRYEAR4 | id | y | y | y | |
| PEAFNOW | cat | y | |||
| PEMLR | cat | y | y | y | |
| PEHRWANT | cat | y | y | ||
| PESCHENR | cat | y | |||
| PEDWWNTO | cat | y | y | ||
| TELE2019 | cat | y | y | y | |
| TELECOVID | cat | y | y | y | |
| TELENOW | cat | y | y | y | |
| EMPA | calculated | y | |||
| EMPB | calculated | y | |||
| EMPC | calculated | y | |||
| EMPD | calculated | y | |||
| EMPSTAT | calculated | y | y | ||
| TELEALL | calculated | y | y | ||
| CORR | calculated | y | y | ||
| GESTFIPS | cat | y | |||
| GTMETSTA | cat | y | |||
| HEHOUSUT | cat | y | |||
| HETENURE | cat | y | |||
| HRHTYPE | cat | y | |||
| HRNUMHOU_c | cont > cat | y | |||
| HUSPNISH | cat | y | |||
| PEABSRSN | cat | y | |||
| PEAFEVER | cat | y | |||
| PECERT1 | cat | y | |||
| PECERT3 | cat | y | |||
| PECYC | cat | y | |||
| PEDIPGED | cat | y | |||
| PEDISDRS | cat | y | |||
| PEDISEAR | cat | y | |||
| PEDISEYE | cat | y | |||
| PEDISOUT | cat | y | |||
| PEDISPHY | cat | y | |||
| PEDISREM | cat | y | |||
| PEERNCOV | cat | y | |||
| PEERNHRY | cont | y | |||
| PEGRPROF | cat | y | |||
| PEHSPNON | cat | y | |||
| PEMARITL | cat | y | |||
| PEMJOT | cat | y | |||
| PESEX | cat | y | |||
| PRCITSHP | cat | y | |||
| PRDISFLG | cat | y | |||
| PRERNHLY_c | cont > cat | y | |||
| PRMARSTA | cat | y | |||
| PRNMCHLD_c | cont > cat | y | |||
| PRTAGE_c | cont > cat | y | |||
| PTDTRACE | cat | y | |||
| PUAFEVER | cat | y | |||
| PUBUS1 | cat | y | |||
| PEDW4WK | cat | y | |||
| PEDWAVL | cat | y | |||
| PEDWAVR | cat | y | |||
| PEDWLKO | cat | y | |||
| PEDWWK | cat | y | |||
| PEHRACT1 | cat | y | |||
| PEHRACT2 | cat | y | |||
| PEHRACTT | cat | y | |||
| PEHRAVL | cat | y | |||
| PEHRFTPT | cat | y | |||
| PEHRRSN1 | cat | y | |||
| PEHRRSN2 | cat | y | |||
| PEHRRSN3 | cat | y | |||
| PEHRUSL1 | cont | y | |||
| PEHRUSL2 | cont | y | |||
| PEHRUSLT | cont | y | |||
| PEJHWKO | cat | y | |||
| PENLFACT | cat | y | |||
| PENLFJH | cat | y | |||
| PENLFRET | cat | y | |||
| PERET1 | cat | y | |||
| PRABSREA | cat | y | |||
| PREMP | cat | y | |||
| PREMPHRS | cat | y | |||
| PREMPNOT | cat | y | |||
| PRFTLF | cat | y | |||
| PRHRUSL | cat | y | |||
| PRNLFSCH | cat | y | |||
| PRPTHRS | cat | y | |||
| PRPTREA | cat | y | |||
| PRSJMJ | cat | y | |||
| PRWKSCH | cat | y | |||
| PRWKSTAT | cat | y | |||
| PRWNTJOB | cat | y | |||
| PTCOVID1 | cat | y | y | ||
| PTCOVID2 | cat | y | |||
| PTCOVR1 | cat | y | y | ||
| PTCOVR2 | cat | y | |||
| PTCOVR3 | cat | y | y | ||
| PTCOVR4 | cat | y | |||
| PUABSOT | cat | y | |||
| PUDIS | cat | y | |||
| PUDIS1 | cat | y | |||
| PUDIS2 | cat | y | |||
| PURETOT | cat | y | |||
| PUWK | cat | y | |||
| rank | calculated | y | y |
Appendix B: Target Populations
Top16 – Variables >1 standard deviation above mean in CORR=1 rate
| Variable_dimension | % CORR=1 | Description |
| PEDISDRS_1 | 86.03% | disability: difficulty dressing or bathing |
| PEDISOUT_1 | 81.29% | disability: difficulty running errands or going out alone |
| PEDISPHY_1 | 76.69% | disability: serious difficulty walking or going up stairs |
| PTDTRACE_6 | 72.85% | white-Black |
| PTDTRACE_8 | 70.22% | white-Asian |
| PEDISREM_1 | 68.69% | disability: serious cognitive or memory difficulties |
| HRHTYPE_2 | 67.19% | husband/wife primary family in Armed Forces |
| PRDISFLG_1 | 64.84% | any disability |
| HRNUMHOU_c_6 | 64.73% | household size >9 |
| PEDISEYE_1 | 64.24% | disability: serious difficulty with vision |
| HRNUMHOU_c_5 | 63.38% | household size 7-8 |
Top25 – in addition to above; variables in the top quartile of CORR=1 rate
| Variable_dimension | % CORR=1 | Description |
| HRNUMHOU_c_4 | 61.49% | household size 5-6 |
| PTDTRACE_7 | 61.31% | white-Native |
| HRHTYPE_4 | 59.41% | female civilian head of household |
| PRNMCHLD_c_1 | 58.83% | no children |
| HEHOUSUT_5 | 56.48% | mobile home or trailer with no permanent rooms |
| GESTFIPS_28 | 55.77% | MS |
| HEHOUSUT_6 | 54.73% | mobile home or trailer w/room(s) added |
| HETENURE_2 | 54.51% | rent home |
| PTDTRACE_2 | 54.38% | Black |
| PTDTRACE_3 | 54.13% | Native |
| GESTFIPS_56 | 54.10% | WY |
| GESTFIPS_2 | 54.00% | AK |
| HETENURE_3 | 53.99% | housing not owned and no cash rent paid |
| PRCITSHP_1 | 53.93% | US-born citizen |
| GESTFIPS_21 | 53.91% | KY |
| GESTFIPS_23 | 53.85% | ME |
| GESTFIPS_22 | 53.72% | LA |
| GESTFIPS_19 | 53.49% | IA |
| HRHTYPE_3 | 53.43% | civilian male head of household |
| GESTFIPS_5 | 53.29% | AR |
| PESEX_1 | 53.26% | male |
| GTMETSTA_2 | 53.20% | non-metro area |
| GESTFIPS_47 | 53.06% | TN |
| PEHSPNON_1 | 52.90% | Hispanic/Latino |
| GESTFIPS_40 | 52.83% | OK |
| GESTFIPS_20 | 52.78% | KS |
| HRNUMHOU_c_3 | 52.72% | household size 3-4 |
Appendix C: OLS Linear Regression Summaries
Training model on 30% of full dataset:
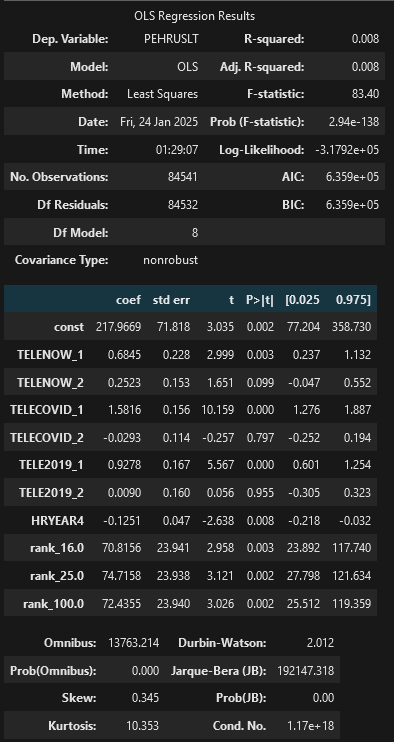
Top 16 model:

Top 25 model:

Leave a comment